What you will learn
- How to enter accumulator volume, pressure, water level and demand data.
- How to interpret stored steam, supply time and charging rate.
- How to export a calculation report as PDF.
- How to export inputs and results as CSV.
- How to read the saturation dome and constant-volume path on the P–v diagram.
1. Open the calculator
Open the CADBoostPro Steam Accumulator Calculator. The application runs entirely in your browser, so no software installation or account is required. The calculator uses IAPWS-IF97 water and steam properties and performs the calculation locally on your device.
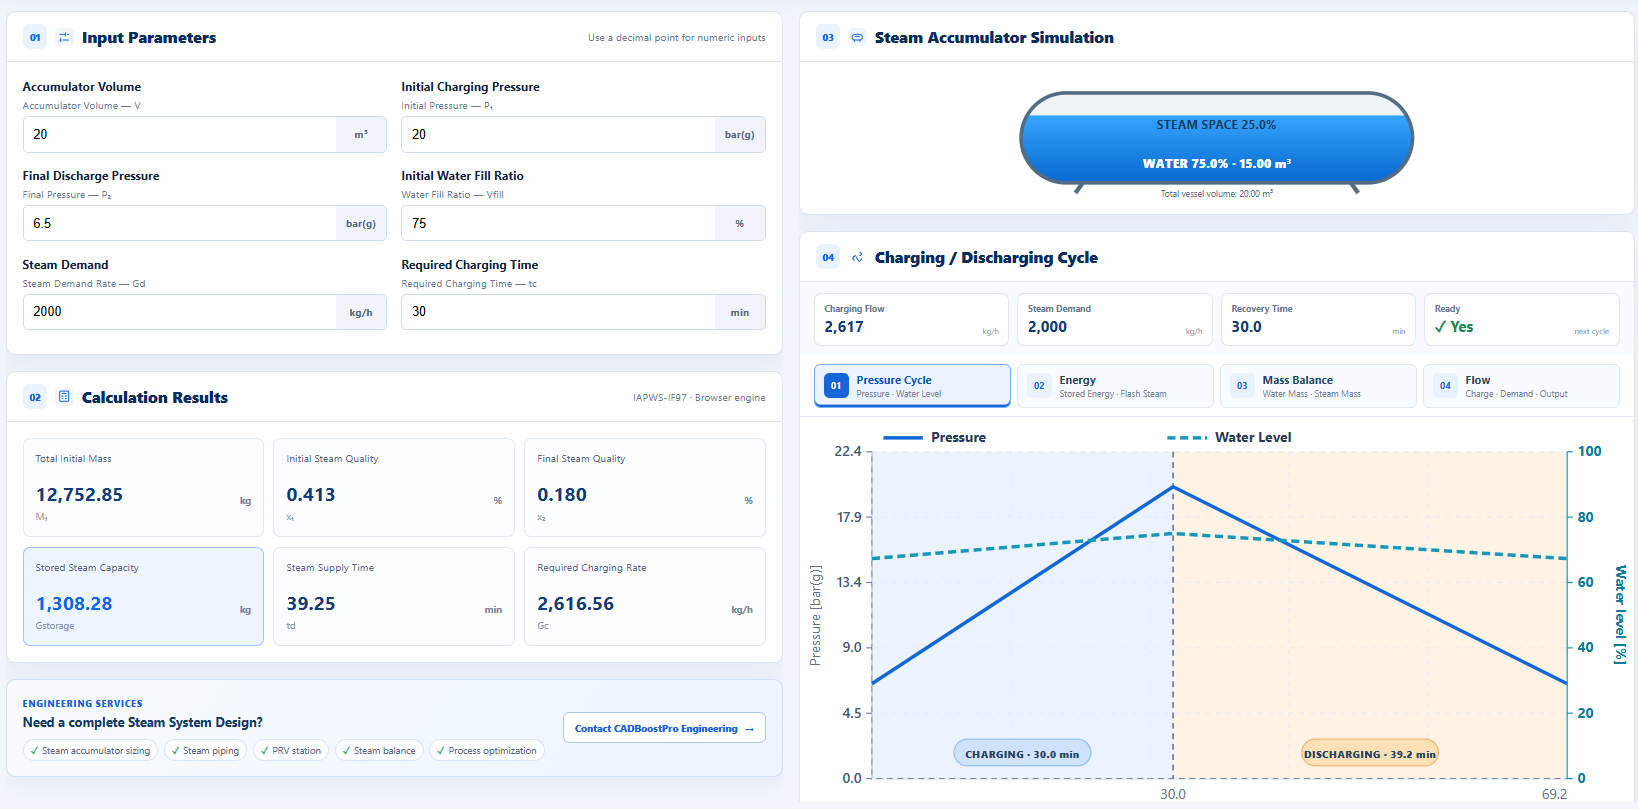
The screen is divided into two working areas. The left side contains input fields, calculated results and export controls. The right side contains the vessel visualization and the charging/discharging, P–v and T–s diagrams. On smaller screens these areas are arranged vertically.
2. Enter the input parameters
Enter the design conditions in the Input Parameters panel. Use a decimal point when entering decimal values. Pressure inputs are gauge pressures in bar(g); the calculation automatically converts them to absolute pressure before requesting IF97 properties.
| Input | Meaning | How to choose it |
|---|---|---|
| Accumulator Volume | Total internal vessel volume in m³. | Use the actual internal volume or a preliminary vessel size being evaluated. |
| Initial Charging Pressure | Upper pressure at the end of charging. | Use the normal accumulator charging pressure, not the vessel design pressure. |
| Final Discharge Pressure | Lowest pressure allowed at the end of discharge. | Keep enough pressure for downstream piping, control valves and process users. |
| Initial Water Fill Ratio | Percentage of vessel volume occupied by water before discharge. | Use the intended operating level. Do not assume that a completely full vessel is acceptable. |
| Steam Demand | Steam flow required by the process during the peak. | Enter the peak demand or the flow deficit that the accumulator must support. |
| Required Charging Time | Time available to restore the released steam. | Use the interval between demand peaks or production batches. |
Pressure check
The charging pressure must be higher than the final discharge pressure. Both values must remain inside the saturated-water range supported by IAPWS-IF97 and within the safe operating limits of the actual system.
3. Run the calculation
Select Calculate in the upper-right toolbar. Results update immediately, together with the vessel visualization and all diagrams. If an input is invalid, the calculator displays a message below the input grid. Correct the highlighted engineering condition and run the calculation again.
Select Reset to restore the example values. Resetting is useful when comparing a new case with the standard 20 m³ example, but it replaces the values currently shown in the form.
4. Understand the calculated results
Total Initial Mass
The combined mass of saturated water and steam inside the vessel at the charging condition.
Initial and Final Quality
The steam mass fraction of the two-phase mixture at the beginning and end of the modeled process.
Stored Steam Capacity
The estimated mass of useful steam released between the selected upper and lower pressures.
Steam Supply Time
Stored steam divided by the entered steam demand, expressed in minutes.
Required Charging Rate
The average surplus steam flow needed to recharge the accumulator in the specified time.
Water Volume
The vessel water inventory represented in the accumulator visualization.
Use the results for preliminary sizing and sensitivity studies. A final installation still requires pressure-vessel design, nozzle and piping calculations, safety-valve sizing, controls, water-hammer review and verification by a qualified engineer.
How to Export PDF
- Complete the input fields and select Calculate.
- Review the result cards and diagrams to confirm that the case is the one you want to document.
- Select Export PDF in the top toolbar. The browser print window will open.
- Choose Save as PDF or the equivalent PDF printer available in your browser.
- Select the desired paper settings and save the file to your project folder.
The print layout removes navigation controls and rearranges the engineering panels for a cleaner report. The exact Save as PDF wording can vary between Chrome, Edge, Firefox and the operating system print dialog.
How to Export CSV
- Run the calculation so the current results are available.
- Select Export CSV in the toolbar.
- Your browser saves a file named
steam_accumulator_result.csv. - Open the file in Excel, LibreOffice Calc or another spreadsheet application.
The CSV contains separate input and result rows with parameter name, engineering symbol, value and unit. It uses a semicolon delimiter and includes a UTF-8 byte-order mark so engineering symbols display correctly in common spreadsheet software. CSV is the preferred format when you want to compare several cases, create a design register or transfer results into another calculation workbook.
How to Read the P–v Diagram
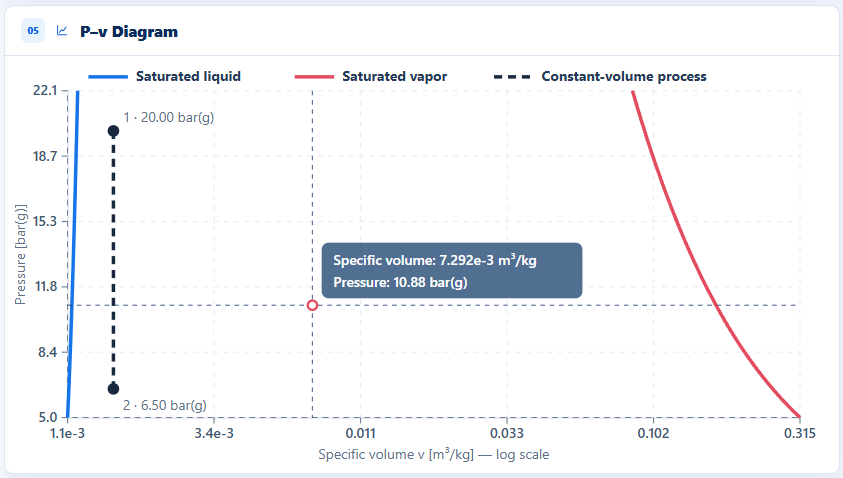
The P–v diagram plots pressure P on the vertical axis and specific volume v on the horizontal axis. The horizontal axis uses a logarithmic scale because saturated-liquid and saturated-vapor specific volumes differ by several orders of magnitude.
The blue boundary represents saturated liquid. The red boundary represents saturated vapor. Together they form the saturation dome. States between these boundaries contain both liquid water and steam. A point close to the liquid boundary has a low steam quality, while a point close to the vapor boundary has a high steam quality.
The dashed line between points 1 and 2 represents the modeled constant-volume change as accumulator pressure falls. Although the overall vessel volume is fixed, steam leaves and the phase distribution changes. The diagram is therefore a visualization of the calculated initial and final mixture states rather than a complete time-resolved simulation of every internal flow.
Move the pointer across the chart to inspect pressure and specific-volume coordinates. If the calculated final quality falls outside the saturation dome, the calculator shows a warning. This indicates that the assumed two-phase model and selected inputs should be reviewed.
Reading the other diagrams
Charging / Discharging Cycle
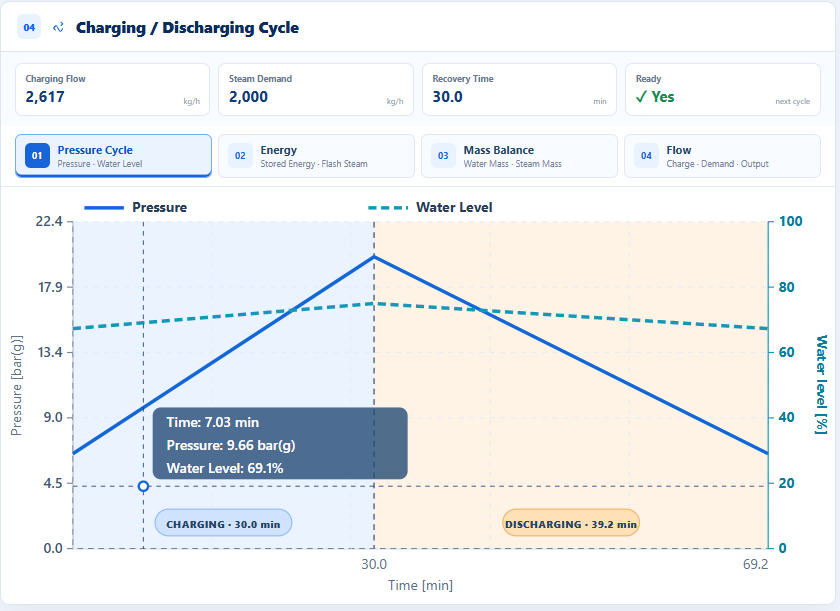
The cycle panel starts at the discharged condition, rises to the charged condition, and returns to the lower-pressure state during discharge. The blue background identifies charging and the pale orange background identifies discharging. KPI cards above the chart show charging flow, steam demand, recovery time and readiness for the next cycle.
Pressure Cycle
Compares vessel pressure with water level as the accumulator charges and discharges.
Energy
Shows remaining stored energy as a percentage and cumulative flash steam generated in kilograms.
Mass Balance
Separates water mass from steam mass. Each curve has its own vertical scale because liquid inventory is much larger than the steam-space mass.
Flow
Compares charging flow, process steam demand and steam output during the two operating phases.
Move the pointer across any cycle tab to display time and each plotted value on separate lines. The connecting segments show the trend between calculated end states; they are not a detailed transient simulation of internal vessel mixing.
T–s Diagram
The T–s diagram plots temperature against specific entropy. The saturation boundaries enclose the two-phase region, while points 1 and 2 show the modeled accumulator states at the upper and lower pressures. Use it as a thermodynamic interpretation aid alongside the numerical results.
Recommended engineering workflow
- Build a realistic time-based steam demand profile.
- Enter an initial vessel size and operating-pressure range.
- Check stored capacity and steam supply time.
- Verify that the required charging rate is available between peaks.
- Compare alternative fill ratios, pressures and vessel volumes.
- Export shortlisted cases to CSV for comparison.
- Save the selected case as PDF and record the design assumptions.
- Complete mechanical, safety, piping and control-system design before procurement.