The Engineering Problem
Stable fluidization depends on distributing primary air across the bed as evenly as practical. When a header and windbox allow momentum to control the flow without adequate guidance, some nozzles receive too much air while others receive too little. The result can be local spouting, dead zones, poor bed-material mixing and a greater risk of localized slagging.
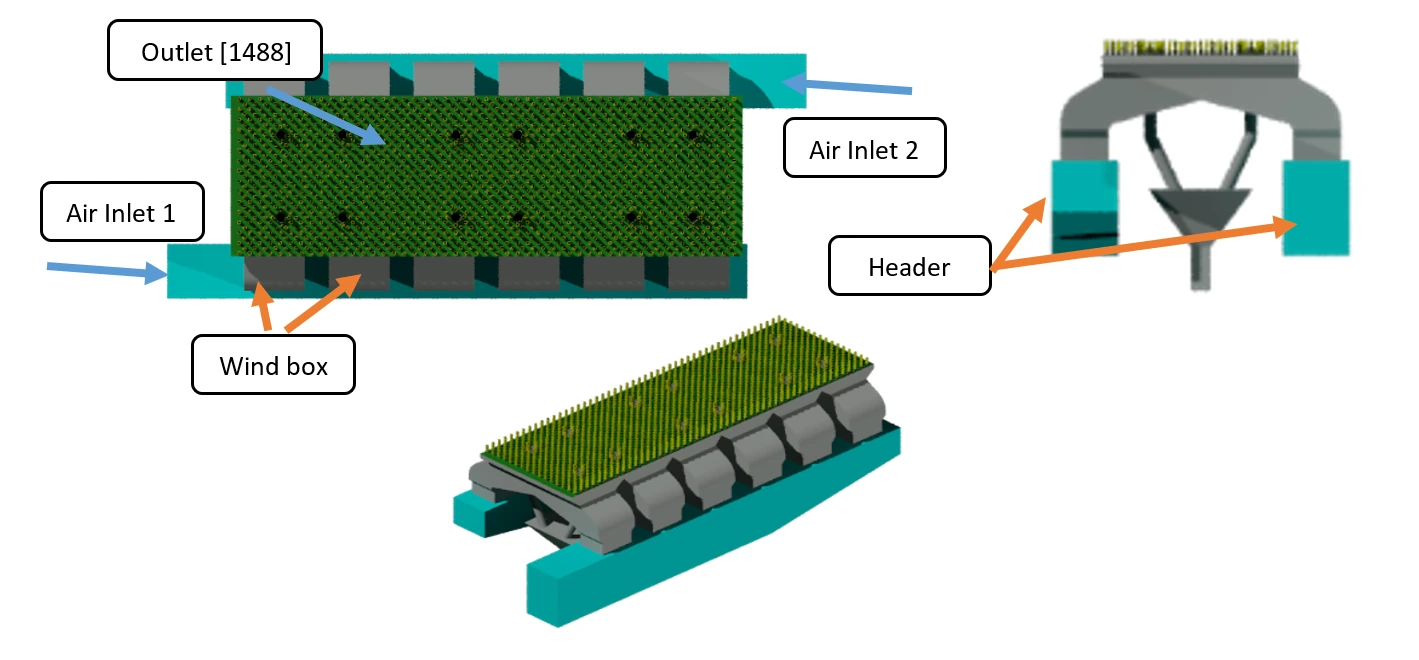
In this project, I used OpenFOAM to evaluate the existing air-supply arrangement and develop baffles for both the header and windbox. My analysis focused on cold-flow air distribution; it did not model chemical reactions inside the furnace.
Case Study at a Glance
- Software: OpenFOAM v2412.
- Workflow: fast 2D screening followed by 3D verification.
- Header solution: five optimized baffles.
- Windbox solution: two optimized baffles.
- Verified non-uniformity: approximately 11% at the header and 10.1% at the windbox outlets.
1. Baseline Design Without Baffles
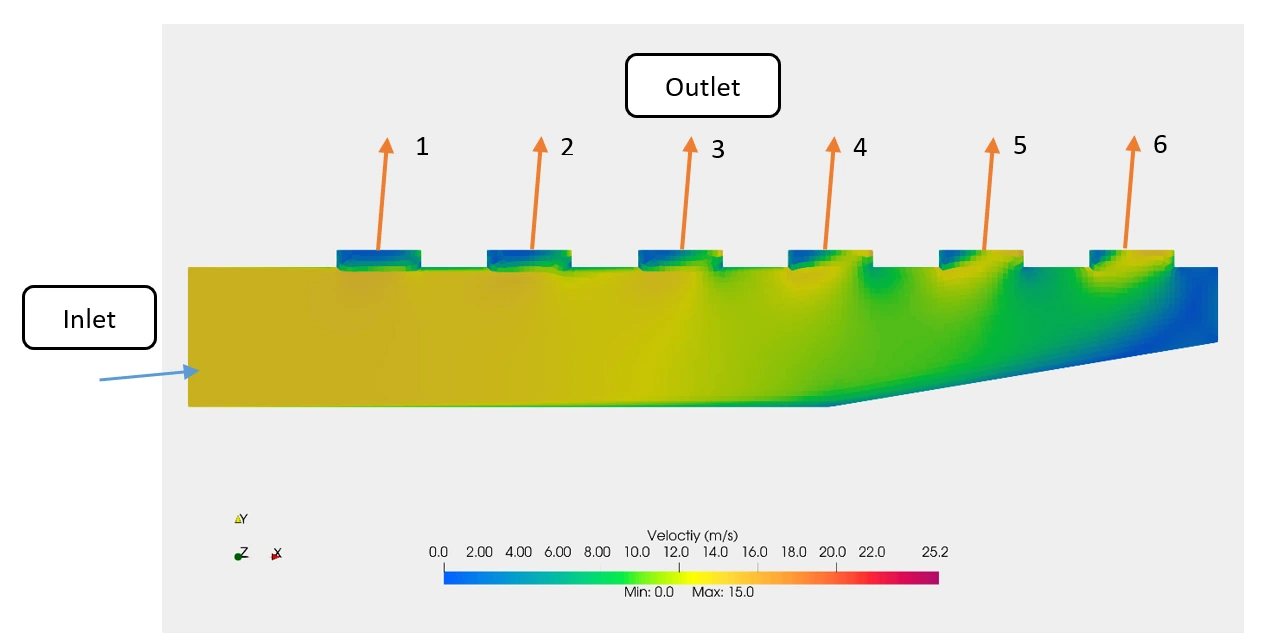
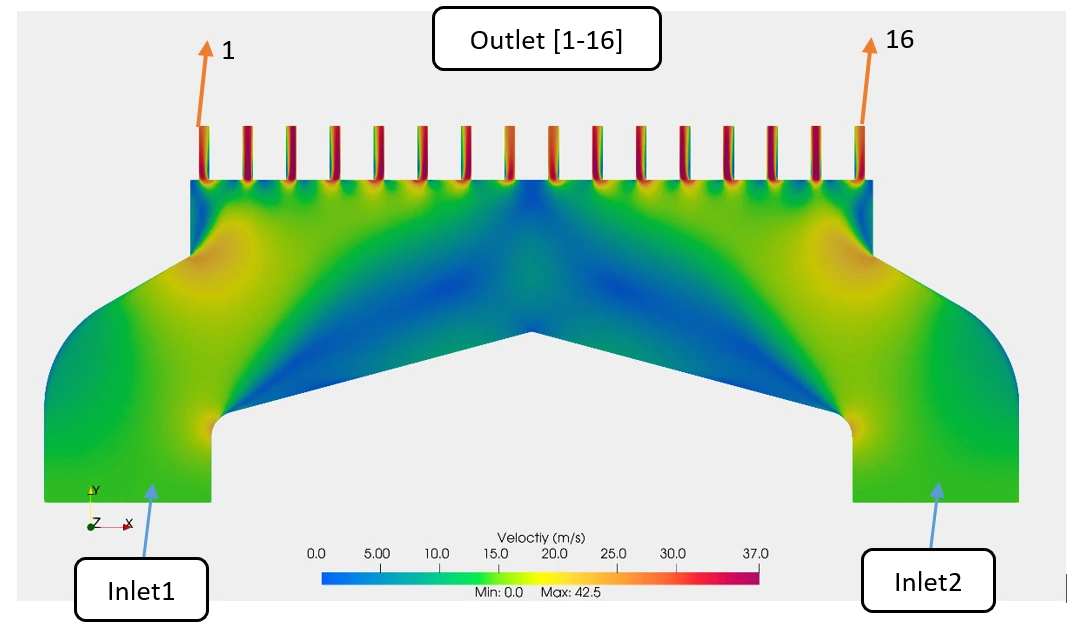
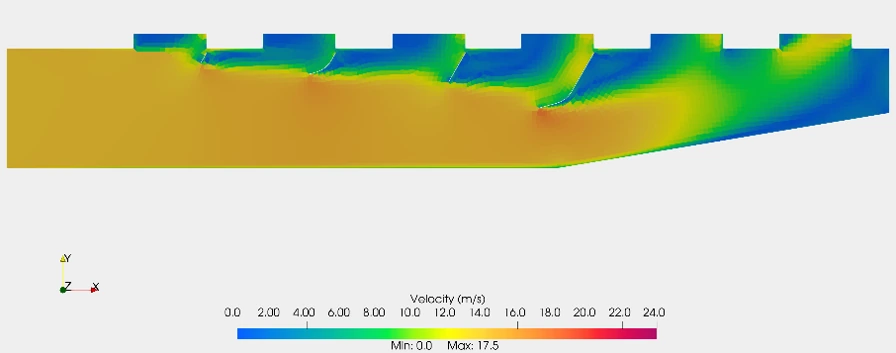
The original geometry did not include turning vanes or flow-distribution baffles. Air therefore followed the easiest momentum path through bends and expansions. In the header model, outlets 1 and 2 received very little flow while outlets 5 and 6 received substantially more. This imbalance was then passed downstream to the windbox.
Header behavior
Strong outlet-to-outlet imbalance, recirculation and excessive flow toward the far outlets.
Windbox behavior
Uneven nozzle velocity with a reported min-to-max variation of approximately 23%.
Why this matters
Air maldistribution does not prove that slagging or unstable combustion will occur, but it creates the local high- and low-air regions that make those operating problems more likely.
2. CFD Method: 2D Screening and 3D Verification
Running every concept as a full three-dimensional model would have made design iteration unnecessarily slow. The calculation domain was therefore separated into the header and windbox, and representative sections were used to screen baffle concepts in two dimensions. The best candidates were then rebuilt and checked in 3D.
The header outlet results were also used as inlet boundary conditions for the windbox stage. This preserved the upstream flow imbalance instead of assuming ideal, uniform windbox inlets.
Domain decomposition
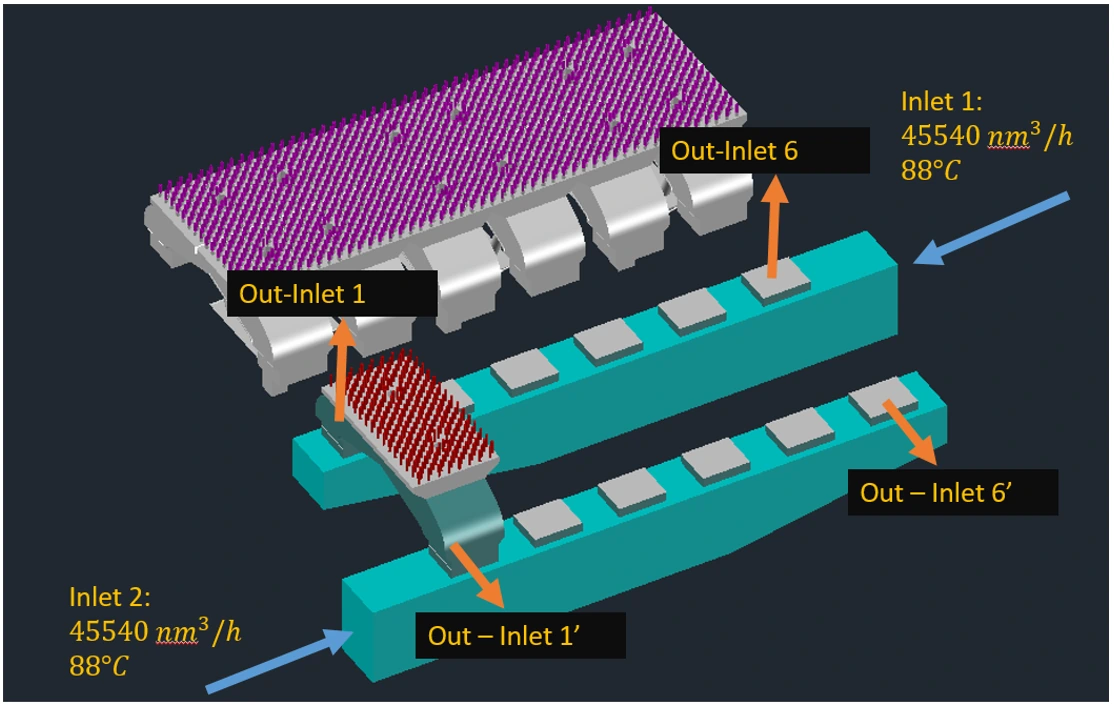
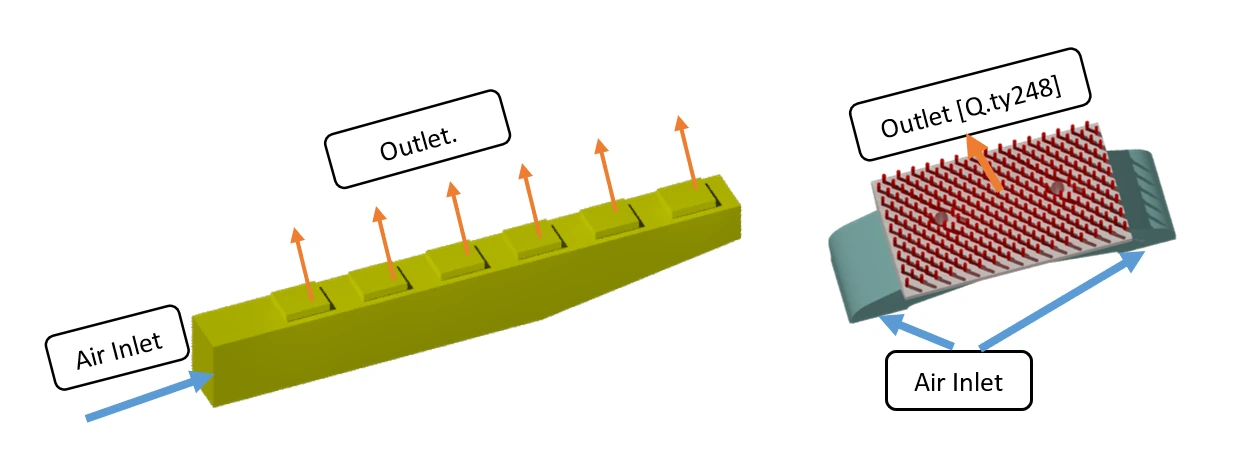
The complete air path contains two headers, repeated windbox sections and a large number of fluidizing nozzles. Instead of solving every design iteration as one large model, the domain was divided into two linked stages:
- Header stage: one representative header was solved and the velocity and flow at its six outlets were extracted.
- Windbox stage: the six header outlet datasets were applied sequentially to representative windbox inlets, preserving the upstream distribution produced by the header.
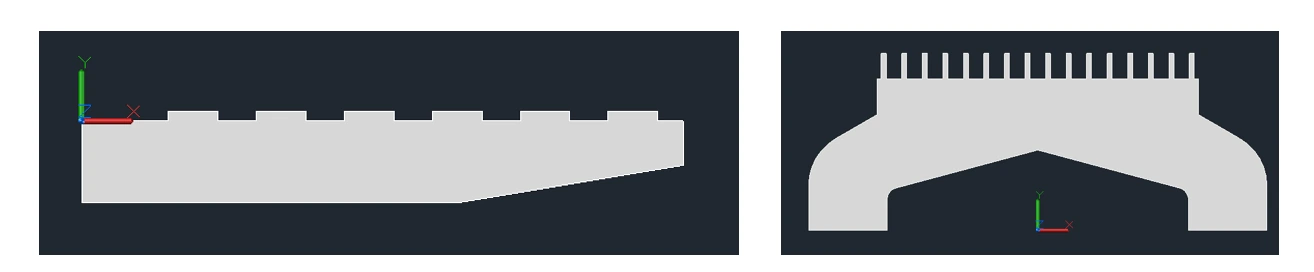
Because the main flow sections were geometrically repetitive, representative 3D sections could be reduced to 2D screening domains. This allowed finer attention around nozzles, bends and baffle edges without using full-model resources for every candidate.
3. Main Calculation Inputs
| Item | Value | Purpose |
|---|---|---|
| Normal flow per header | 45,540 Nm³/h | Specified air supply |
| Air temperature | 88°C | Convert normal to actual volume flow |
| Calculated actual flow | Approximately 60,211 m³/h | Operating flow condition |
| Header inlet area | 0.9 m × 1.3 m | Velocity calculation |
| Estimated inlet velocity | Approximately 14.3 m/s | Header inlet boundary condition |
| CFD software | OpenFOAM ESI v2412 | Flow solution and post-processing |
| Compute platform | Dual Xeon Gold 6138, 64 processors | Parallel 3D calculations |
| Reported calculation time | Approximately 38 hours per case using 64 processors | Reported compute configuration |
Flow conversion used for the inlet
The specified header flow was given at normal conditions. Correcting it to the operating air temperature of 88°C increased the actual volume flow from 45,540 Nm³/h to approximately 60,211 m³/h. Dividing this value by the 1.17 m² inlet area gives an estimated inlet velocity of approximately 14.3 m/s.
This conversion is important because applying the normal volume directly to the operating-temperature geometry would understate the actual volumetric flow and change the calculated velocity field.
Model assumptions and result interpretation
The purpose of the model was to compare internal flow-distribution concepts, not to reproduce every operating phenomenon inside the furnace. The modeled fluid domain therefore represented the air path through the header, windbox and nozzle outlets. The bed material above the nozzles, fuel particles, combustion reactions and heat transfer through the furnace walls were outside this calculation scope.
This distinction matters when interpreting a velocity contour. A contour shows where the model predicts high and low velocity for the selected boundary conditions. It does not directly show combustion efficiency, slag formation or bed temperature. Those operating effects depend on additional variables such as bed pressure, sand inventory, fuel feeding, nozzle condition, excess oxygen and furnace heat release. The CFD result identifies an important hydraulic cause that can contribute to those effects.
The comparison also assumes that candidate designs are evaluated with consistent inlet conditions and outlet definitions. Changing the total flow, air density or outlet pressure between cases would make it difficult to isolate the influence of the baffles. For this reason, the useful comparison is not simply the most colorful contour. It is the change in outlet distribution, recirculation pattern and local restriction under equivalent operating conditions.
What was evaluated
Velocity distribution, outlet-to-outlet balance, flow guidance, recirculation and the effect of baffle geometry.
What was not evaluated
Fuel conversion, chemical reaction, emissions, bed-material motion, erosion rate and thermal expansion.
Mesh refinement is especially important around baffle tips, outlet throats and turning regions, where velocity gradients can be steep. These regions control both distribution and local pressure loss. A practical verification process should confirm that further mesh refinement does not materially change the outlet-flow ranking or the reported imbalance. The final 3D stage then checks whether conclusions from the simplified 2D sections remain valid when side walls, full outlet geometry and three-dimensional flow paths are restored.
4. Header Optimization
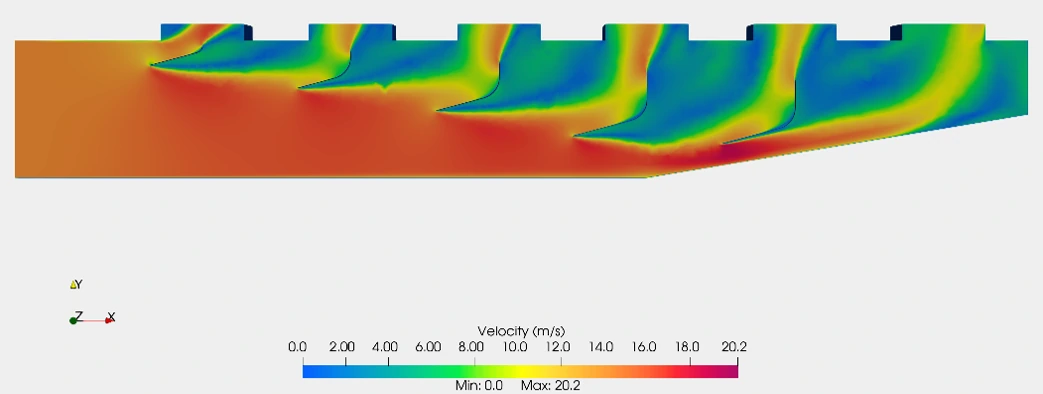
Four baffles began to divide the flow but did not produce a sufficiently even result. An early five-baffle arrangement improved distribution but introduced local restrictions and higher loading on the plates. Refining the baffle profiles reduced these restrictions while guiding air toward all six outlets.
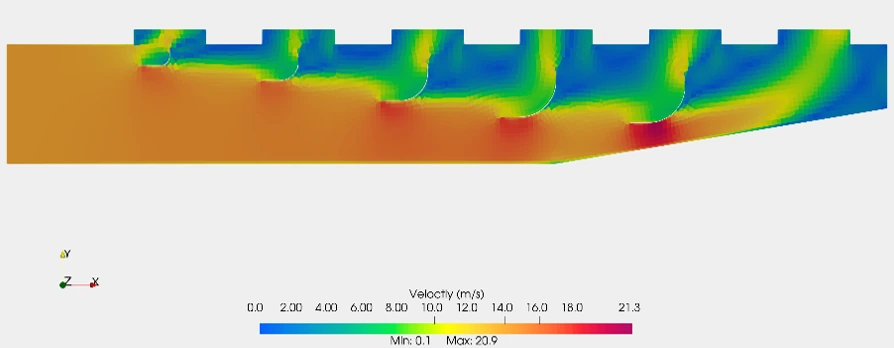
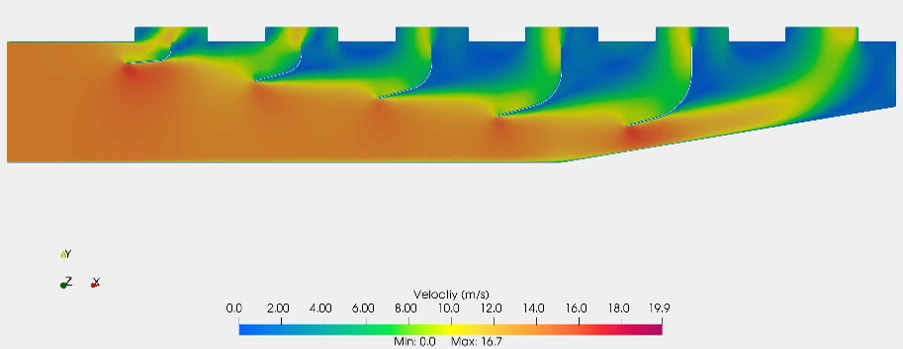
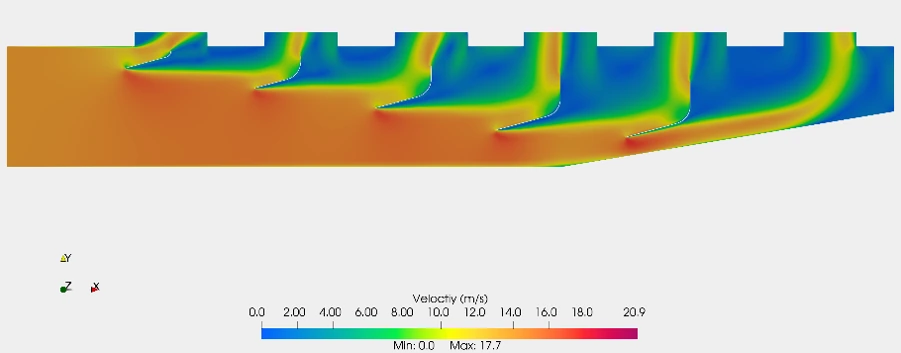
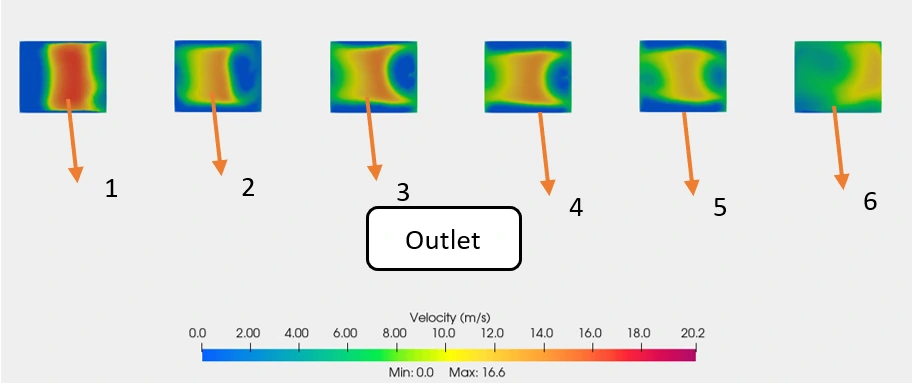
In the final 3D check, the six header outlets had an average velocity of approximately 6.48 m/s. The reported outlet variation was reduced to approximately 11%.
Header outlet comparison
| Outlet | No baffles, 2D (m/s) | Optimized 5 baffles, 2D (m/s) | Final 3D verification (m/s) |
|---|---|---|---|
| 1 | 1.15 | 4.25 | 6.73 |
| 2 | 2.01 | 4.55 | 6.58 |
| 3 | 3.86 | 4.06 | 6.66 |
| 4 | 6.17 | 5.53 | 6.64 |
| 5 | 7.89 | 4.45 | 6.30 |
| 6 | 9.42 | 5.75 | 5.96 |
| Average | 5.08 | 4.77 | 6.48 |
The baseline values reveal why an average alone is not enough: the average velocity was 5.08 m/s, but outlet 6 received more than eight times the velocity at outlet 1. After optimization, the outlet values clustered much more closely around their respective model averages.
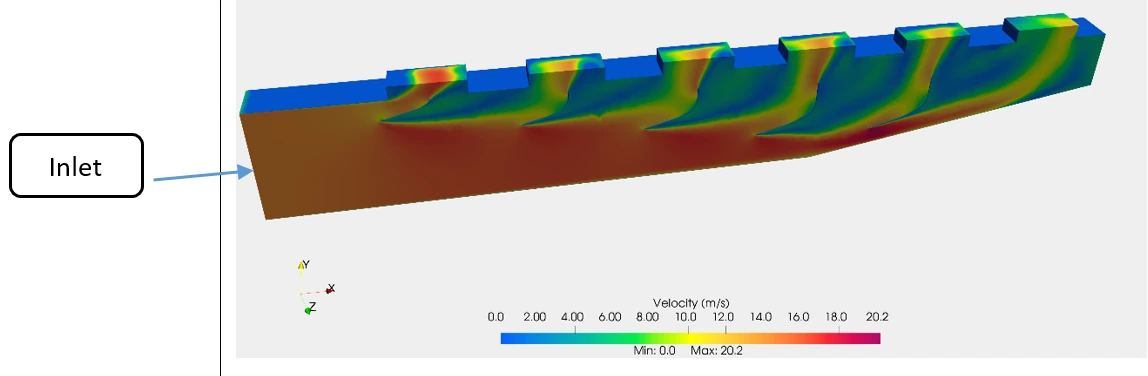
5. Windbox Optimization
The unmodified 2D windbox showed approximately 23% variation between the lowest and highest outlet values. Adding two baffles redistributed the incoming jets and reduced the screened variation to approximately 15.4%.
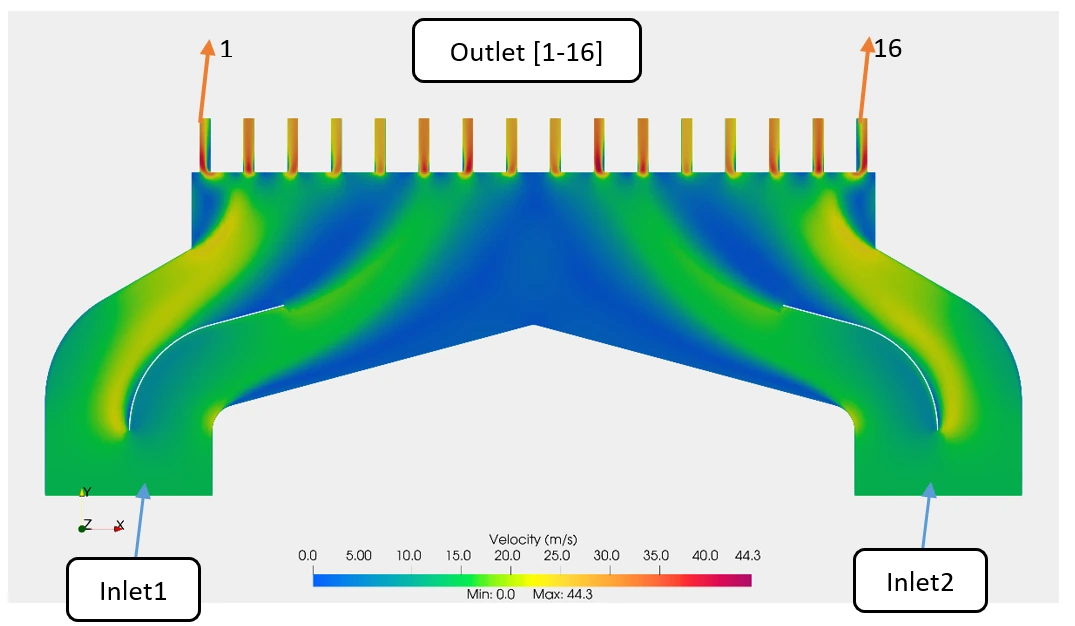
The final 3D windbox model represented 248 air-nozzle outlets. It produced an average outlet velocity of approximately 19.4 m/s and a reported variation of approximately 10.1%.
Windbox screening statistics
| Model | Minimum outlet velocity | Average outlet velocity | Maximum outlet velocity | Reported variation |
|---|---|---|---|---|
| 2D without baffles | 24.54 m/s | 26.82 m/s | 30.20 m/s | Approximately 23% |
| 2D with two baffles | 25.13 m/s | 27.43 m/s | 29.81 m/s | Approximately 15.4% |
| Final 3D, 248 outlets | Approximately 17.88 m/s | 19.4 m/s | Approximately 19.89 m/s | Approximately 10.1% |
The detailed 248-outlet dataset was reviewed in the calculation report. For web presentation, the minimum, average and maximum values communicate the distribution more clearly than reproducing all 248 rows.
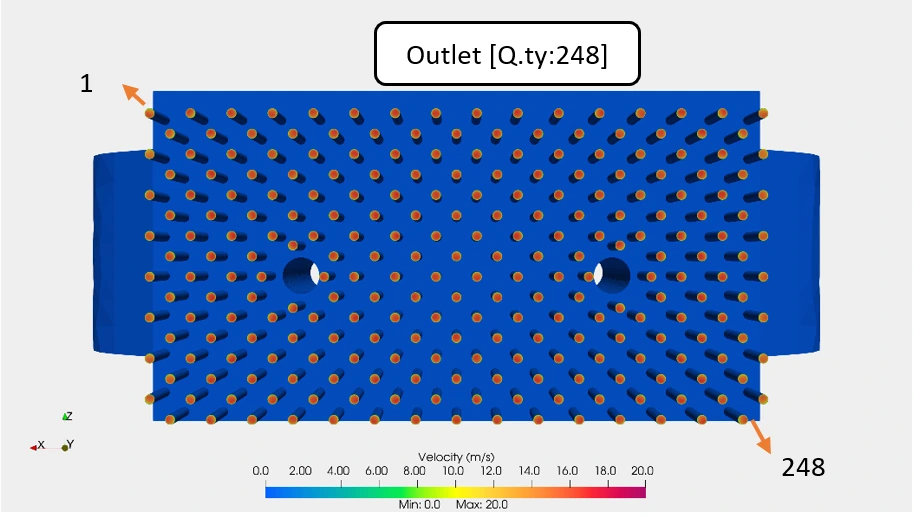
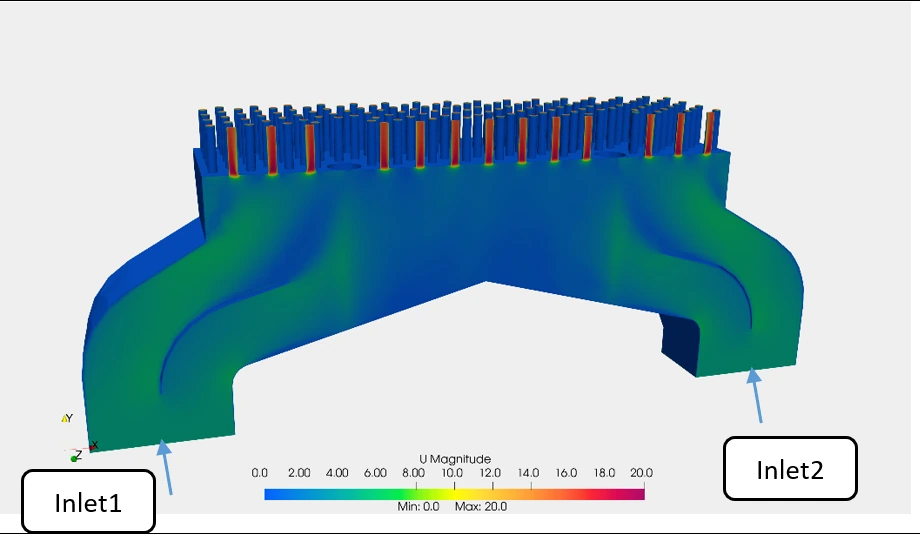
6. Results Before and After Improvement
| Component | Baseline | Improved design | Verified outcome |
|---|---|---|---|
| Header | No baffles; flow concentrated at outlets 5 and 6 | Five optimized baffles | Approximately 11% variation |
| Windbox | No baffles; approximately 23% variation | Two optimized baffles | Approximately 10.1% variation |
7. Practical Engineering Impact
More uniform primary-air delivery gives the fluidized bed a better hydraulic foundation. It can help reduce low-air dead zones, excessive local jets and uneven bed agitation. Those improvements can in turn support more stable fluidization, more consistent heat transfer and lower operational risk.
The value of CFD in this project was not simply producing velocity contours. It provided a controlled way to compare baffle concepts before fabrication, reject restrictive arrangements and verify the selected geometry at full three-dimensional scale.
8. Design Lessons from the Study
More baffles do not automatically produce a better design
The progression from four baffles to several five-baffle profiles illustrates a common CFD design lesson. Increasing the number of flow-guiding elements can improve distribution, but an aggressive plate angle or narrow passage can also create excessive acceleration, separation and pressure loss. The design objective is therefore not to force every streamline into a prescribed path. It is to redistribute momentum gradually while keeping the flow passages practical for fabrication and operation.
The upstream component cannot be ignored
A windbox may appear to perform well when it is tested with perfectly uniform inlet conditions. In the real system, however, its inlet flow comes from the header. If the header delivers six different flow conditions, the windbox must operate with that non-uniformity. Passing the header results into the windbox calculations made the workflow more representative and prevented the downstream design from being optimized for an unrealistically ideal inlet.
Average velocity is not a sufficient acceptance criterion
The baseline header demonstrates this clearly. Its average outlet velocity appeared reasonable, yet the first outlet was close to 1.15 m/s while the sixth exceeded 9.4 m/s. A single average value concealed a severe distribution problem. Design review should therefore consider the minimum, maximum, spread and spatial pattern of the outlets, together with the total mass-flow balance.
2D and 3D models serve different decisions
The 2D models were valuable because they allowed multiple concepts to be compared quickly and made the main flow mechanisms easy to see. The 3D models were valuable because they restored the real outlet arrangement and cross-flow effects. Using only 3D would have made early iteration expensive; using only 2D would have left uncertainty about the final geometry. The staged approach used each model where it provided the greatest engineering value.
9. Engineering Recommendations
- Install five header baffles using the optimized profiles and positions established in the 3D model.
- Install two windbox baffles at the simulated locations to guide both inlet streams toward the full nozzle field.
- Control baffle angle, spacing and edge alignment during fabrication; small geometric changes can modify both distribution and pressure loss.
- Avoid abrupt baffle shapes that create local high velocity, excessive resistance or long-term erosion risk.
- Inspect nozzle blockage and bed pressure after commissioning so that field behavior can be compared with the clean-domain CFD model.
- Use pressure measurements across the header, windbox and bed to confirm that improved distribution has not introduced unacceptable system resistance.
Verification after installation
CFD supports the design decision, but final acceptance should include fan operating data, pressure-drop measurements and inspection of bed behavior at representative boiler loads.
10. Scope and Limitations
- This was a cold-flow CFD study; combustion chemistry, heat release and emissions were outside its scope.
- Uniform outlet velocity supports fluidization but does not by itself guarantee uniform combustion.
- Final performance also depends on nozzle condition, bed inventory, fuel distribution and operating controls.
- Field measurements should be used to confirm pressure loss and air distribution after installation.
11. Frequently Asked Questions
Why not optimize the complete furnace in one CFD model?
A complete model can be useful at the final verification stage, but it is inefficient for screening many baffle concepts. Separating the header and windbox reduced iteration time and made it easier to identify which component caused a particular imbalance. The selected concepts could then be checked in 3D before being issued as design recommendations.
Does a 10.1% outlet variation guarantee stable fluidization?
No. It indicates that the modeled windbox distributes air much more evenly than the baseline arrangement. Actual fluidization also depends on nozzle resistance, bed depth, particle-size distribution, sand condition, air leakage and fan control. The CFD result improves confidence in the air-supply geometry but does not replace commissioning measurements.
Why can a baffle increase erosion risk?
If a baffle creates a narrow passage or meets the incoming flow at an unfavorable angle, local velocity and turbulence can rise sharply near its leading edge. Dust or entrained particles can then increase wear. This is why the selected geometry should be reviewed for both flow distribution and local acceleration, and why fabrication must preserve the modeled angles and clearances.
Can this workflow be reused for other boiler systems?
Yes. The same logic can be applied to combustion-air ducts, secondary-air headers, burner plenums and heat-exchanger manifolds: screen concepts with an efficient model, transfer realistic upstream conditions downstream, and verify the selected geometry at higher fidelity. The numerical values and acceptance criteria must still be defined for each specific system.
Conclusion
The study showed how a staged CFD workflow can turn an air-distribution problem into a practical design decision. Two-dimensional models made it possible to screen baffle concepts efficiently, while three-dimensional verification confirmed how the selected geometry behaved across the real header and windbox outlets.
With five optimized header baffles and two windbox baffles, the final models achieved substantially more even air delivery. The case demonstrates where CFD creates engineering value: reducing physical trial-and-error, identifying design risks before fabrication and supporting decisions with quantified flow data.